View-angle tilting MRI: Theory and approximations
This text is first of all an explanation and note to myself – but some parts of it might be of more general interest (if this is not the case for you, please just stop reading …).
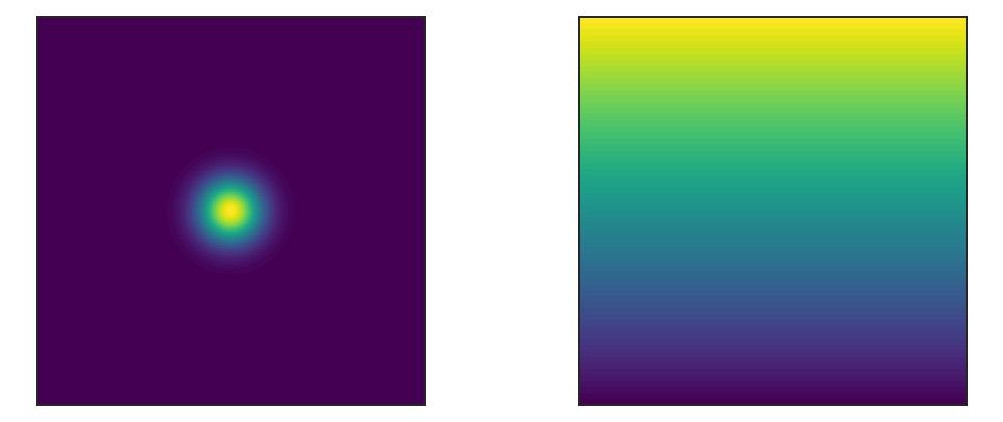
Metallic implants can cause severe image artifacts in MRI. The problem of these implants in MRI is their magnetic susceptibility, χ, that influences the static magnetic field B0 in their neighborhood. Consequently, the (ideally) perfectly homogeneous static field B0(x,y,z) = B0 ez becomes slightly (or not so slightly) inhomogeneous: B0(x,y,z) = B0 + ΔB(x,y,z) (considering only the z component from here on). A simplified two-dimensional example of such an inhomogeneity ΔB(x,z) is shown in the following figure (together with another kind of desired inhomogeneity, namely a linear gradient field).

MR imaging usually relies on the assumption that B0 is homogeneous; the presence of ΔB(x,y,z) results in image artifacts such as voxels moved to wrong positions, signal pile-up, and signal voids.
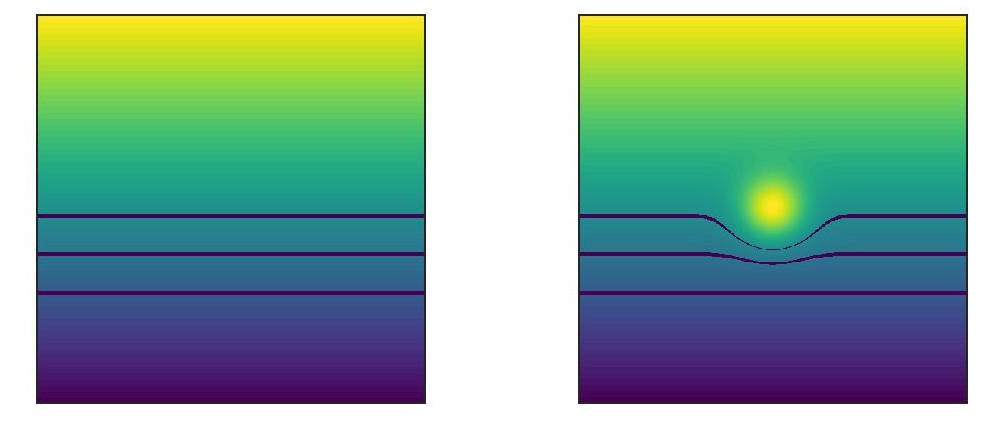
To simplify things, I ignore the phase-encoding direction (y) and restrict this discussion to the frequency-encoding direction (x, with frequency-encoding gradient Gx; displayed horizontally) and the slice direction (z, with slice-selection gradient Gz; displayed vertically). Slice selection in MRI works by applying a slice-selection gradient Gz during excitation. This means that each position z corresponds to a unique Larmor frequency ω(z) = γz Gz, which is used to excite the spins at the desired z positions. A slice is selected by applying a radio-frequency (rf) pulse with a certain frequency (ωrf) and bandwidth (Δωrf). Thus, all spins with Larmor frequencies ωrf ±Δωrf / 2 are excited. For a perfectly linear gradient Gz (i. e., a gradient over a homogeneous background field), these spins form perfect planes (illustrated at the left hand side of the following figure for three different excitation frequencies). In the presence of inhomogeneities, spins are no longer excited in linear planes, but in often very nonlinear structures (illustrated by the central slices on the right hand side).

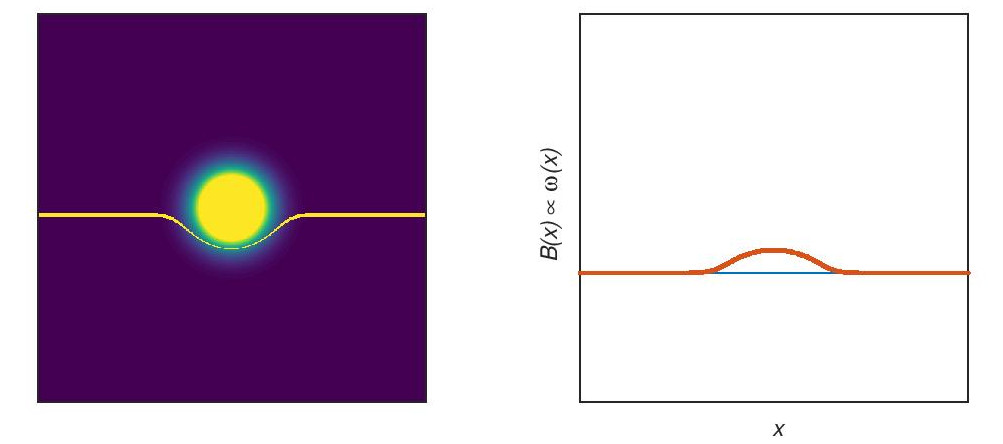
Now look at the central, most severely deformed slice: During slice selection, all Larmor frequencies in this slice (independent of x) were exactly centered around ωrf (only these Larmor frequencies were in resonance with the excitation pulse). However, after switching off the slice-selection gradient (as shown in the next figure), the Larmor frequencies in this slice are no longer the same at all positions: Obviously, the frequencies close to the center are higher due to the field inhomogeneity.

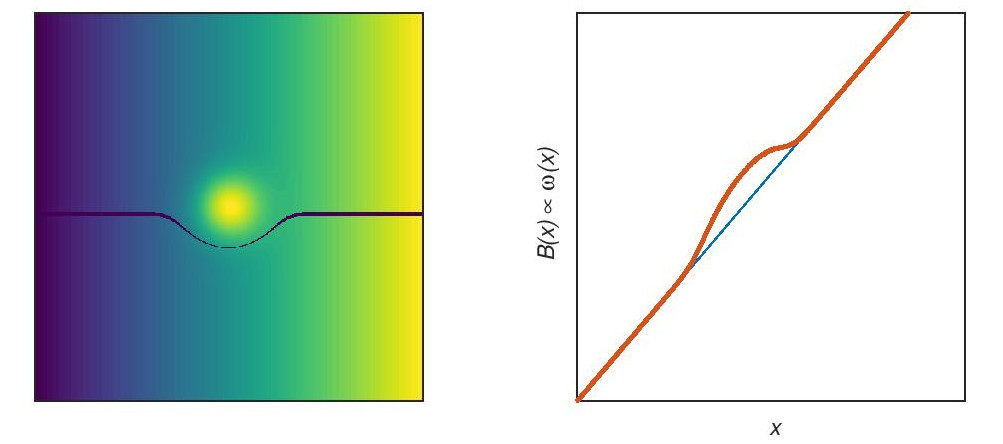
So, a first effect of field inhomogeneities are deformed slice geometries. A second effect results from the remaining field inhomogeneity in the excited slice shown above. This second effect becomes relevant during frequency encoding, when the spin localizations, x, are encoded by Larmor frequencies that are assumed to depend linearly on x: ω(x) = γx Gx. However, in the selected slice, the position x is no longer proportional to the Larmor frequency, ω(x), as shown in the following figure.

The deviation from the linear dependency shifts voxel locations in readout direction resulting in distortion artifacts. This effect (but not the deformed slice geometry) is (at least approximately) corrected by the view-angle tilting (VAT) MRI pulse sequence suggested by Z. H. Cho et al. (1988).
Mathematically, these effects can be analyzed using the basic signal equation of MRI. Without field inhomogeneities, the signal S(t) of the magnetization density ρ(x,z) during the readout is:
Frequently ignored, but here made explicit, is the integral over the slice thickness Δz from z1 to z2 = z1 + Δz. As written above, the position and thickness of the slice are defined (in the case without field inhomogeneities) by the slice-selection gradient Gz and by the frequency (ωrf) as well as bandwidth (Δωrf) of the excitation rf pulse:
The signal equation also shows that each position x is uniquely encoded by a corresponding Larmor frequency ω(x) = γx Gx.
With additional field inhomogeneities, the Larmor frequencies change proportional to ΔB(x,z): during excitation, the frequencies are ω(x,z) = γ(z Gz + ΔB(x,z)) and, during readout, they are ω(x,z) = γ(x Gx + ΔB(x,z)). In both cases, the field inhomogeneity can be directly transformed into spatial shifts:
and
In both cases, the distortions (Δz(x,z) and Δx(x,z)) decrease when stronger gradients (Gz, Gx) are used.
So, in the presence of field inhomogeneities, the signal equation must be changed accordingly by adding an x-dependency to the slice positions z1 and z2 (describing, e. g., the curvy slice shape shown above) as well as using the modified readout frequency:
The slice positions z1,2(x) – and, more generally, the position(s) z(x) corresponding to an excitation frequency ωrf – are given by the following implicit equation (for each value of x):
which can give very nonlinear solutions for z(x), since ΔB(x,z) can be a complicated function of x and z. The slice can even split into several components centered at different z positions, which means that the z integral is not over a single interval, but over several intervals.
The view-angle tilting sequence (shown in the following figure) adds an additional readout gradient in slice-selection direction with the same magnitude Gz as the original slice-selection gradient.
The additional gradient during readout must be included into the signal equation as additional component γGz z of the Larmor frequency:
For the following, a significant approximation is made: The complicated implicit equation for the slice position, z(x), given above is substantially simplified by replacing the x-dependent slice position z(x) as argument inside ΔB(x, z(x)) with the original slice position, ẑ:
The last part of this equation can be easily solved, giving:
where the relation between excitation frequency, ωrf and original slice position, ẑ, was used in the final step: γẑGz = ωrf, i. e., ẑ = ωrf / (γGz).
So, in this approximation, the slice is simply shifted by – ΔB(x, ẑ) / Gz and the slice thickness remains unchanged, i. e.
(A slightly less approximated calculation is presented by K. M. Koch et al. (2010), who introduce a first-order Taylor series:
where D(x, z) = ∂ΔB(x,z) / ∂z is the first derivative of the inhomogeneity function. Then
yielding
This describes shifting and scaling (by 1 + D(x,ẑ) / Gz) of the slice variable, z, and, thus, includes now scaling of the slice thickness.)
Using the simpler (zeroth-order) version z1,2(x) = ẑ1,2 – ΔB(x, ẑ) / Gz, the signal equation reads
and this can be transformed (by substituting z′ = z – ΔB / Gz) to
The innermost parentheses now contain the desired correction term that compensates the shifts in readout (x) direction:
This last equation describes a readout in a tilted readout direction (not longer along Gx, but along the vector (Gx, Gz)), without any distortions (which were related to the canceled term ΔB / Gx) along the readout direction.
Assuming that ρ(x, z′ – ΔB / Gz) does not vary significantly over the the z′ integration interval (say, a thin slice), it can be replaced by ρ(x, ẑ – ΔB / Gz). The integral over z′ can now be performed independently of ρ, resulting in a sinc-shaped modulation of the signal over the time t or, after reconstruction, a certain amount of blurring.
If additional corrections of the slice distortions along the z axis are required, techniques such as “Slice Encoding for Metal Artifact Correction” (SEMAC) as proposed by Lu et al. (2009) can be used in combination with the VAT approach (however, at the cost of substantially prolonged scan times).
pdf version available
URL: <https://dtrx.de/od/mmm/mmm_20200910.html>