View-angle tilting MRI (part 2): Explanations and visualizations
Here I would like to extend the introduction to view-angle tilting (or VAT) MRI posted on 2020-09-10. Using the same field inhomogeneity and slice geometry as in the previous text, I’m trying to provide some more (visual) explanations about what’s going on.
Let’s consider two sample slices as shown in the following figure. Both slices have the same thickness Δz and are really meant to be at the same z position (with respect to the field inhomogeneity that I’m going to add later on); they are only plotted at different z positions to combine them into one diagram.
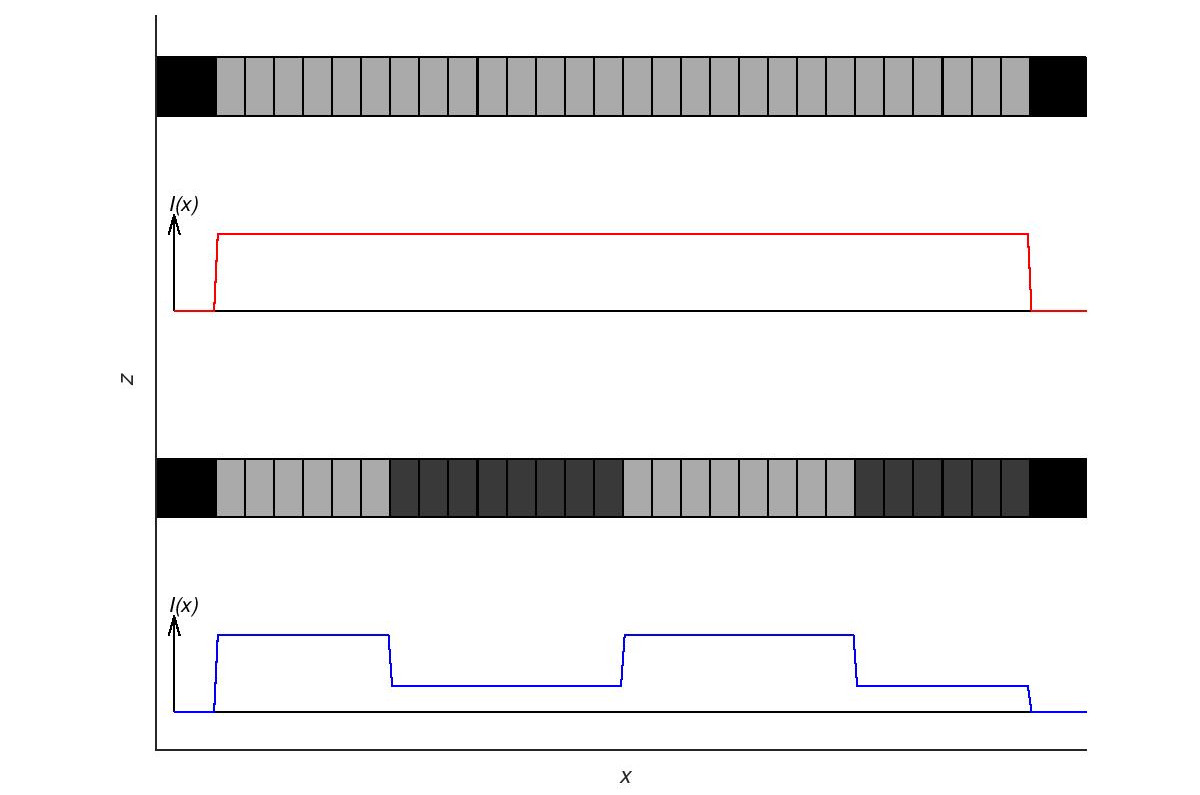
The top slice is a homogeneous slice with the same signal (magnetization density, color-coded in gray) for all x positions (except for the periphery without signal). The bottom slice has alternating signals with two low-signal areas; there is a change from dark to bright signal exactly at the center of the slice. Below each slice, the signal intensity, I(x) – obtained by a readout in x direction – is plotted.
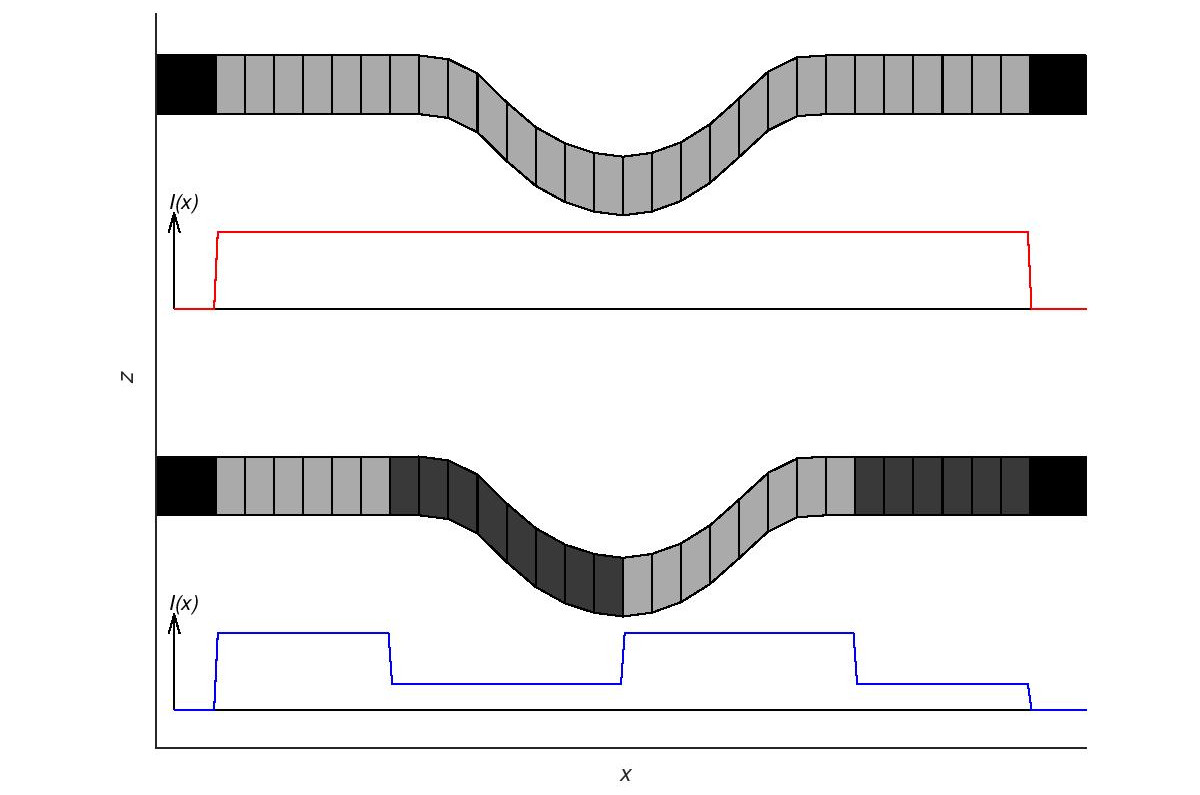
Using the field inhomogeneity defined in the previous text, both slices can be plotted with inhomogeneity-induced distortions in z direction, which is illustrated in the next figure. If we assume (which is generally not the case in real life) that the signal of the underlying object doesn’t vary in slice (z) direction, then the signal intensity I(x) remains exactly the same as before (i. e., the projection of the signals onto the x axis is unchanged). (This is true at least as long as we ignore that the thickness of the excited slice might also change as function of x.)
However, as previously explained the distorted slice geometry is not the only effect of the field inhomogeneity. Field inhomogeneities during readout influence the spatial encoding in readout (x) direction. This is illustrated in the next figure, in which the slice distortion effect in z direction is omitted for better visualization and only in-slice effects are visualized.
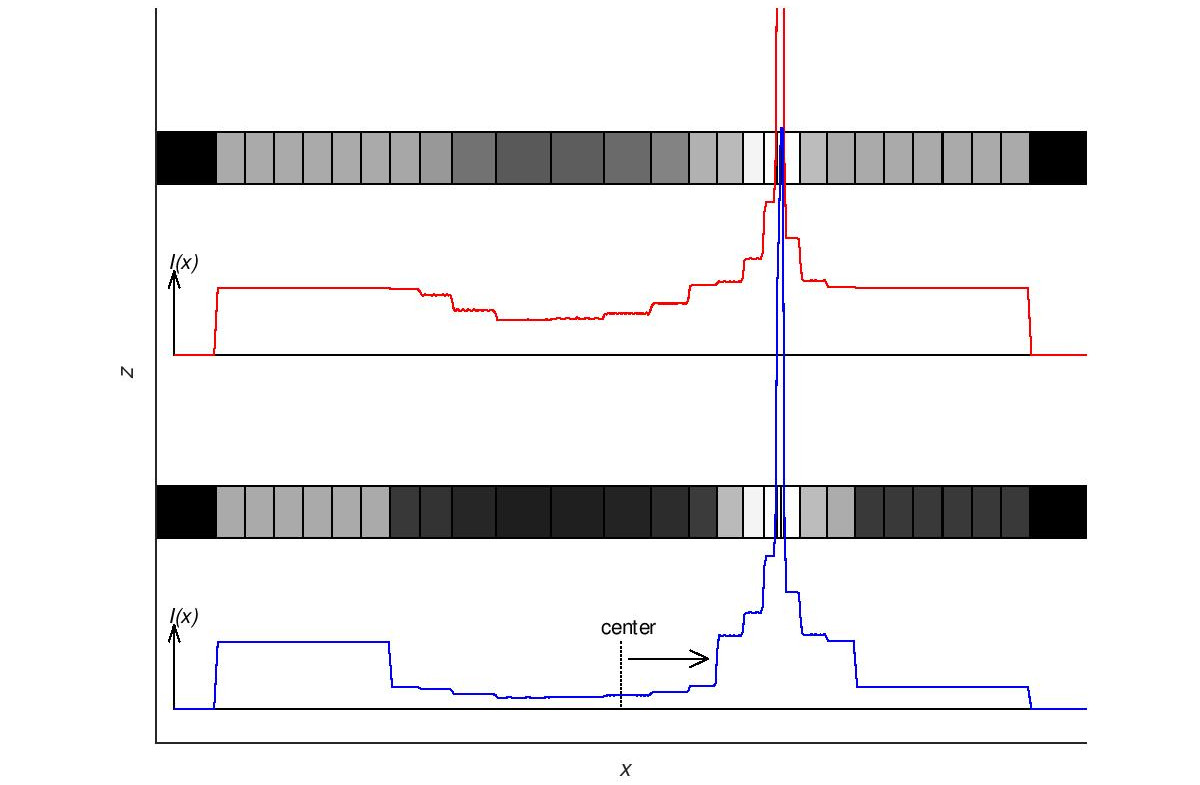
The voxels are scaled in x direction (some are wider, others narrower than in the reference plot above). Since the number of protons in each voxel remains the same, the signal, which is proportional to the proton density, is scaled inversely proportionally to the voxel width, so narrow voxels appear brighter. The strongly increased signal intensity, I(x), in the right half of the plot is called “signal pile-up”.
In addition, the in-slice geometry is distorted which is nicely illustrated in the blue intensity curve: the change from low to high signal is clearly shifted from the exact center to the right-hand side of the plot; this is, of course, a direct consequence of the wider voxels in the left half of the slice.
Both effects, the distorted slice geometry as well as the in-slice signal artifacts are shown together in the following figure. The spatial shift in x direction becomes very obvious as a shift of the minimum of the slice shape to the right. The signal intensity after readout, I(x) remains the same as in the previous figure.
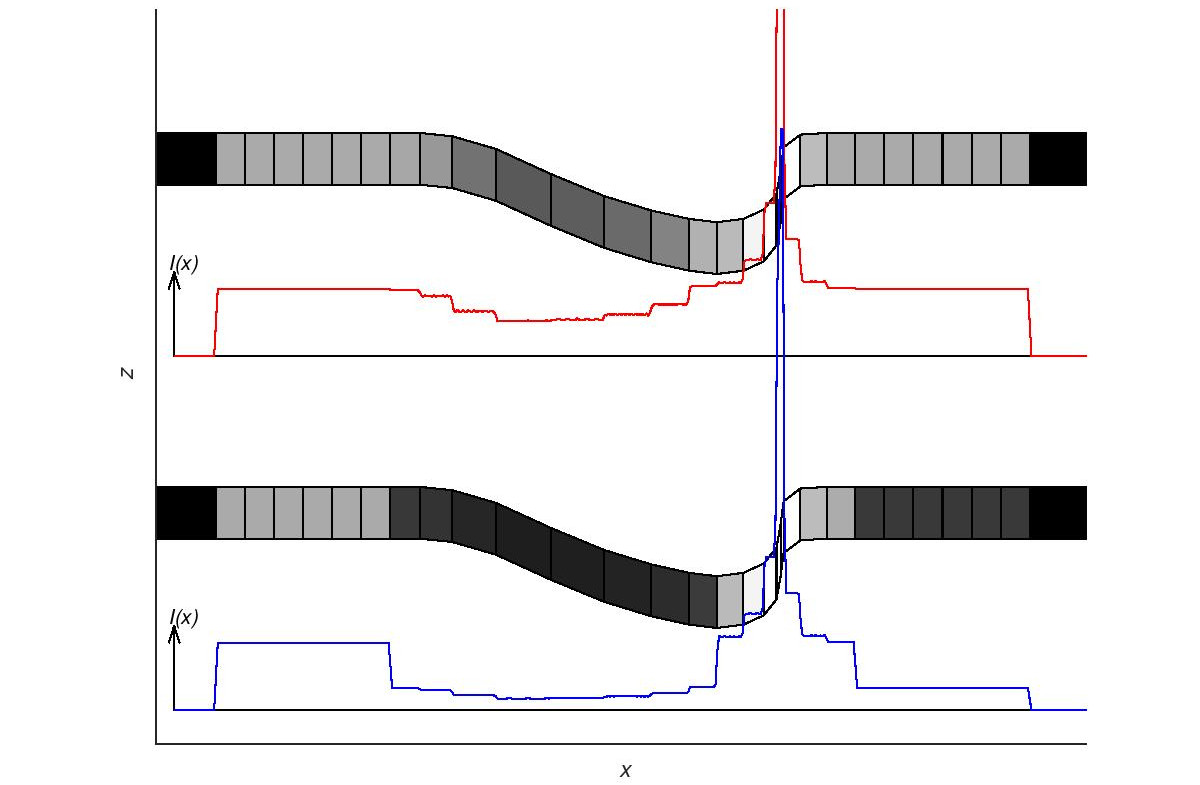
This situation now is the starting point for artifact correction with the view-angle tilting approach. The artifacts shown in the signal intensity curves, I(x), can – perhaps surprisingly – be corrected by a simple change of the view angle as illustrated below.
Just by projecting the distorted spin density onto a tilted axis (shown at the bottom of the following plot), the signal artifacts (areas with low signal or signal pile-up) are corrected. In this example, the projection is numerically evaluated and yields the almost perfectly straight intensity curve in the bottom plot.
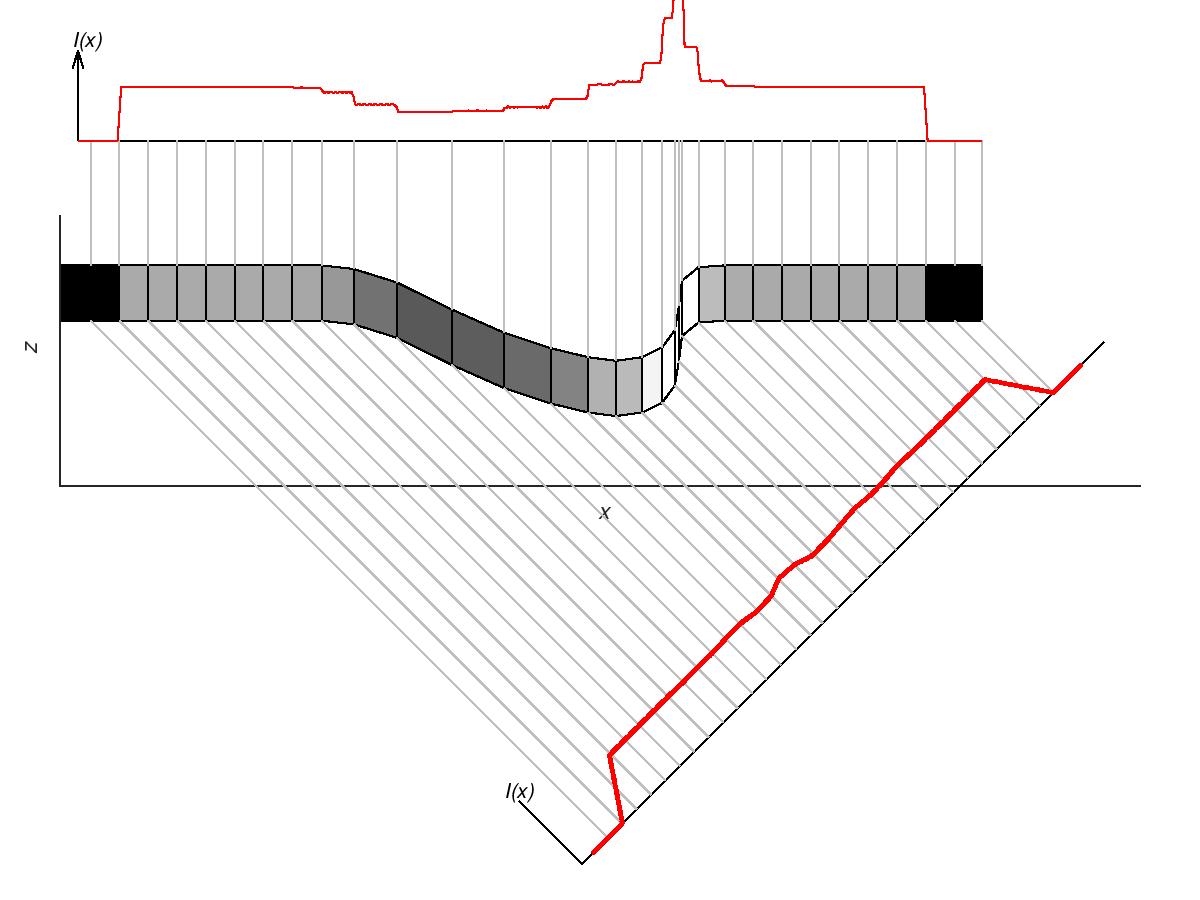
A second visual “proof” of the VAT approach are the gray projection lines (one for each voxel) that appear equidistant in the tilted projection, but very non-equidistant in the conventional projection shown at the top of the figure.
In addition, the sinc-smoothing effect of the VAT pulse sequence is visualized at the periphery of the projected slice, where the signal increases (and decreases) in a relatively long ramp instead of a sharp step.
Finally, it’s interesting to see how the strength, Gz, of the slice-selection gradient influences the VAT approach (assuming that the readout gradient, Gx, is not changed). A lower slice-selection gradient results in more severe through-slice distortions (since the field inhomogeneities are now stronger relative to the gradient). But the increased slice distortion has a surprising advantage in terms of in-slice artifacts as illustrated in the following figure: increased through-slice (z) distortions shift the slice away from the maximum of field inhomogeneities and, thus, reduce the remaining field inhomogeneity in the slice (along the x direction) after excitation.
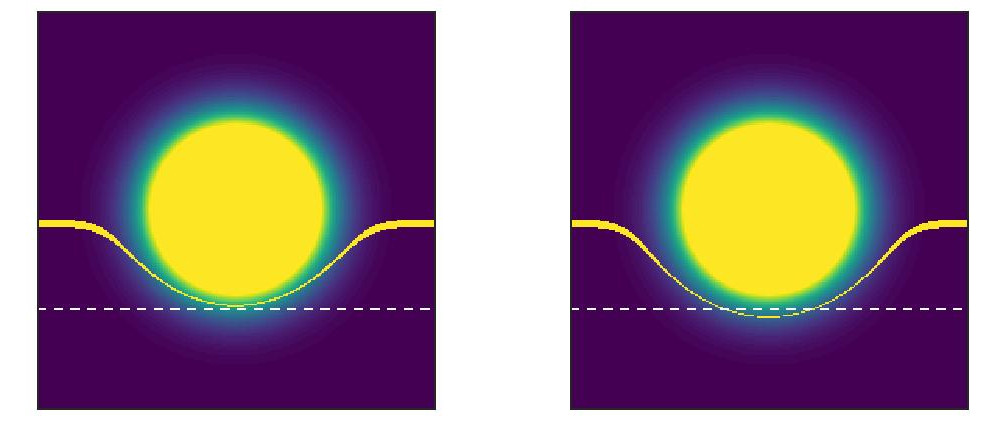
The reduced in-slice artifacts are shown in the next figure together with the uncorrected signal intensity (top) and VAT-corrected intensity (bottom).
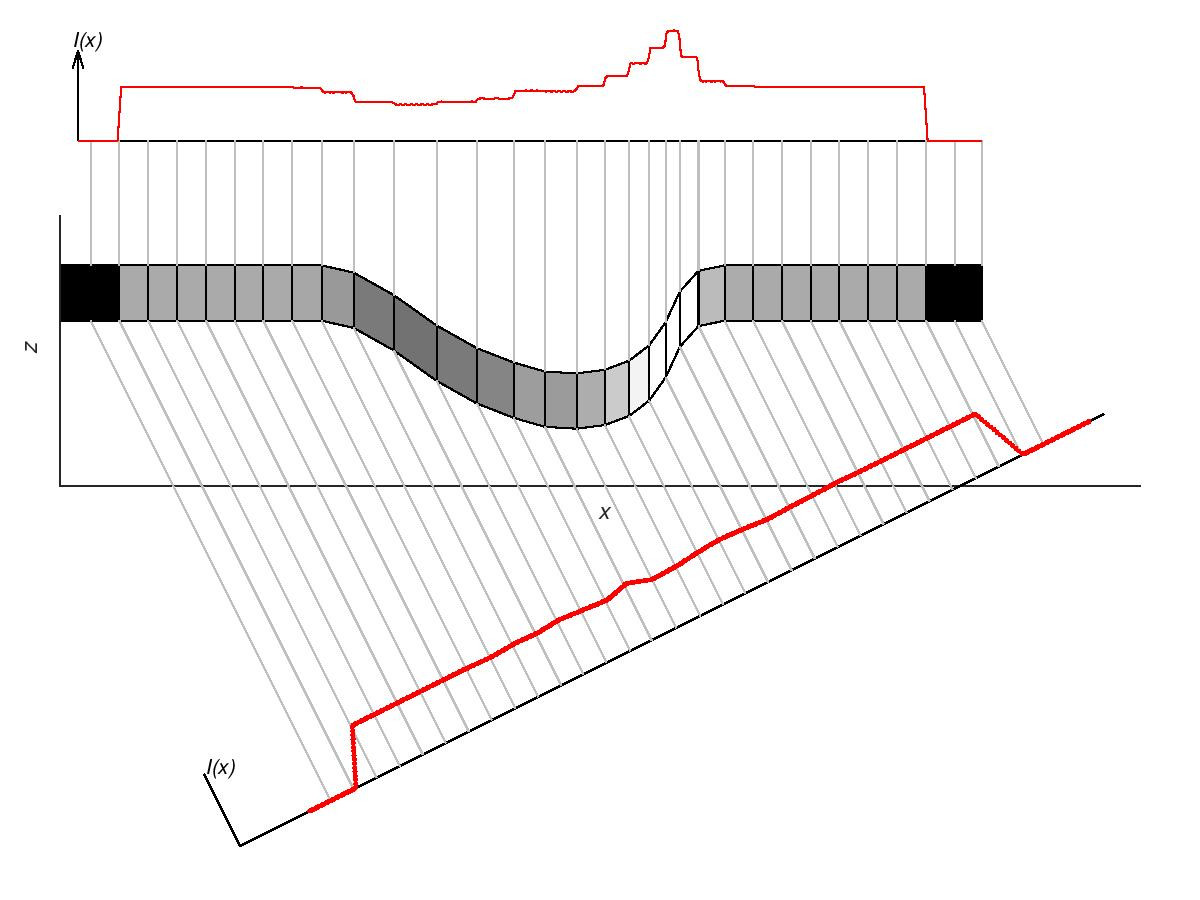
Obviously, the voxels are less distorted along the readout (x) direction, and the uncorrected signal demonstrates reduced signal pile-up. The angle of the tilted axis at the bottom is smaller than above; it’s always arctan(Gz / Gx) which gives 45° in the first case and about 26.565° now. The numerical projection on this axis shows strongly reduced artifacts (compared to the uncorrected readout) as well as reduced sinc-smoothing compared to the VAT readout above.
pdf version available
URL: <https://dtrx.de/od/mmm/mmm_20200915.html>